This article breaks down how to read our reporting & how you can utilize this to better manage your promotional activity.
Analytics Reporting
Analytics reporting allows you as the creator the ability to better dive into your data, and analyze how you are performing based on data metrics such as sales, clicks, commissions and more. The reporting should allow you more control over understanding what is working best for you, and how you can continue to optimize.
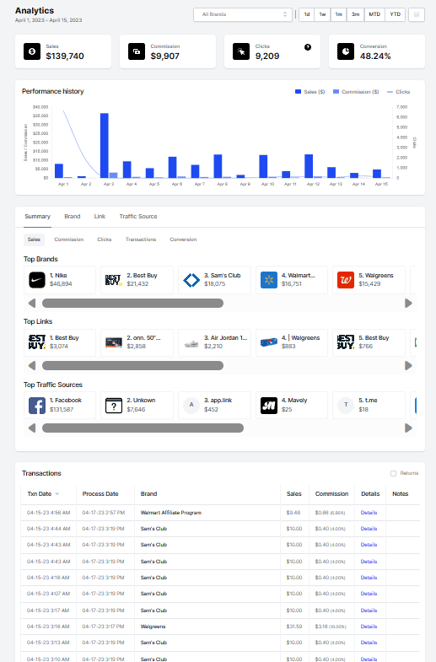
Analytics Glossary of Terms
- Sales: Sales generated on behalf of the brand.
- Clicks: Clicks on your Mavely generated links.
- Commission: % of the sale earned on behalf of a brand.
- Conversion Rate: % of the clicks to revenue tracking conversion of sales.
- Brand: Merchant, brand, retailer being promoted by the creator.
- Links: Tracking URLs created by the creator to a specific brand/ brand product page.
- Traffic Source: Source from which the clicks are tracked to. These are the social media channels that creators promote their links through.
- Transactions: Individual sale / return data processed via Mavely at the order level.
- TXN Date: This is the date that the transaction was initially tracked. This is the sales date for the transaction.
- Process Date: This is the date that Mavely received the transaction.
- Transaction Details: Additional sales detail outlining the individual SKU level detail associated with a transaction.
- Notes: meant to add more insight into an order when applicable. Returns are noted as such in the reporting.
Navigating Analytics
At first glance when you log into your analytics you will see your account overview and your overall performance history, defaulting to the current month to date (MTD), and displaying all brands.
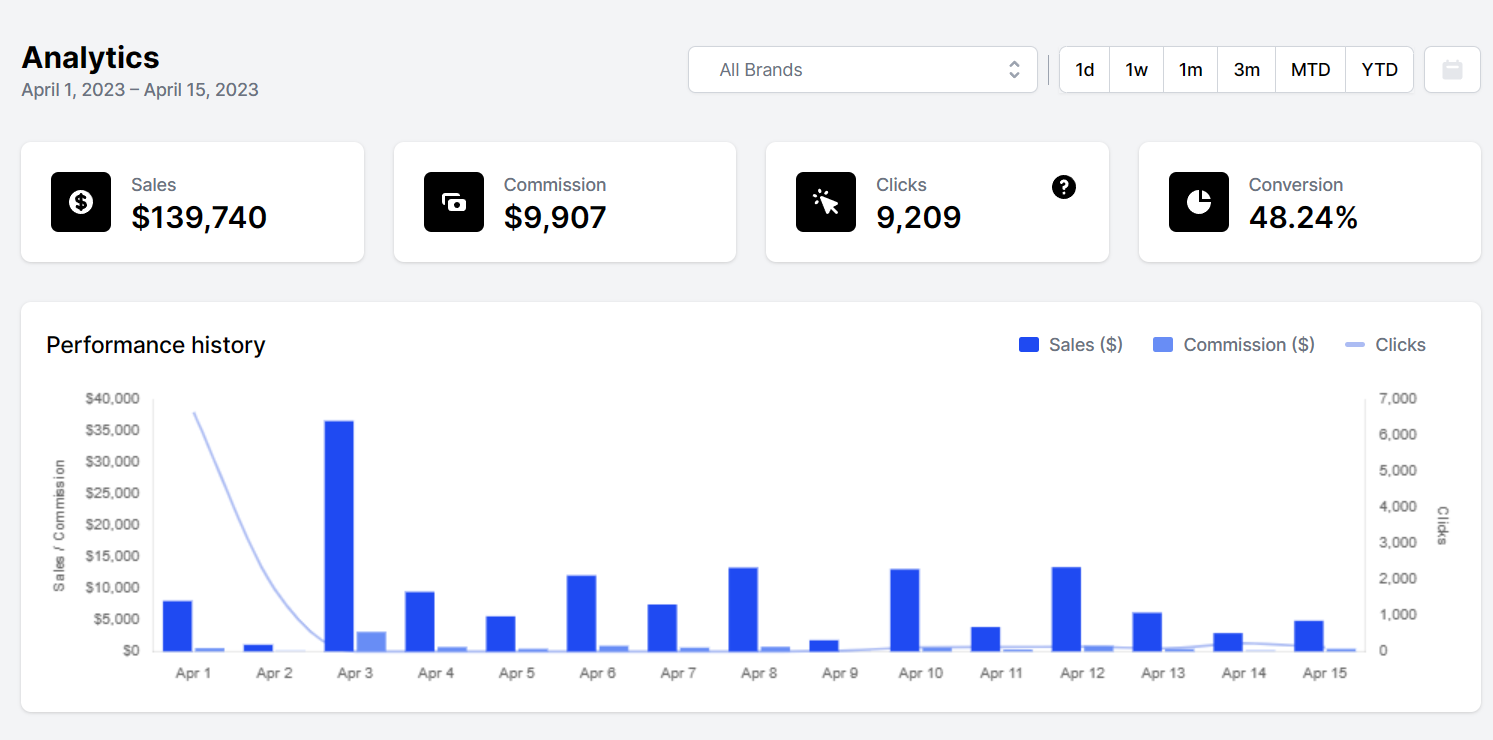
You will be able to see:
-
Sales data for the time frame selected
-
Tentative commissions earned for the time period select.
-
Clicks for the time frame selected.
-
Conversion rate for the time frame selected.
Changing the time frame selections.
If you wish to change the time frame for review, please leverage the date selections, as well as the manual calendar, found on the upper right hand side of the page.

From the above, you can quickly review.
-
1 Day ( Current day)
-
1 week
-
1 month
-
3 month
-
MTD – Month to date
-
YTD- Year to date
You can also use the calendar to select a custom time frame for review.
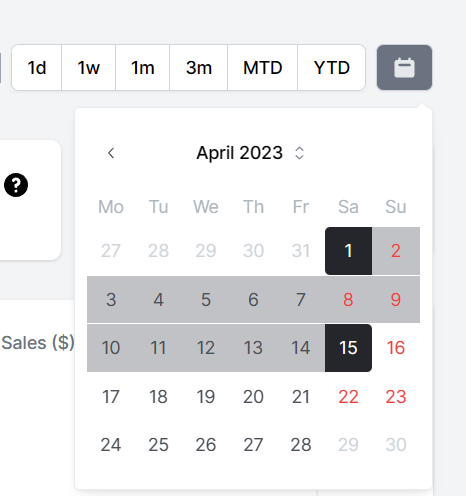
Please note that any changes to the time period you are reviewing, will impact all of the data on the page as a whole.
Performance History

The performance history chart will show you the sales, commissions & clicks by day for the time period you have selected. Changes to the time periods will adjust the shown data on the graph above. Please note that the graph is based on the transaction date.
Filtering by Brand
You have the ability as well to filter the page and results no only by date but also by brand.

You can leverage the brand drop down menu at the top of the page. Click the drop down and select the brand you want to review data for.
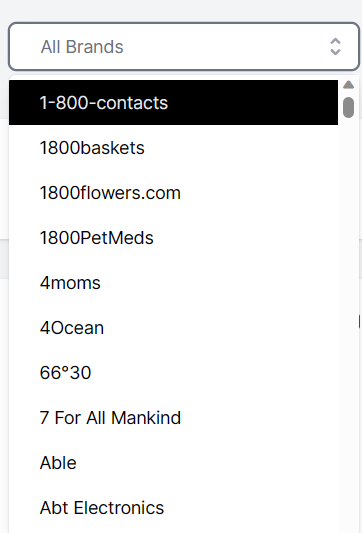
Once you select the brand, all of the reporting detail on the page will filter to the brand selected.
You can then review the data for the single brand across the page until you remove the filter.
Filtering date ranges on the analytics page
You can adjust the time frames you want to review on the page by clicking on the calendar and date features on the upper hand side of the page. See image below.

In addition to the date selector, there is a filters button that will hover over the page as you manage and review your data. See image below.
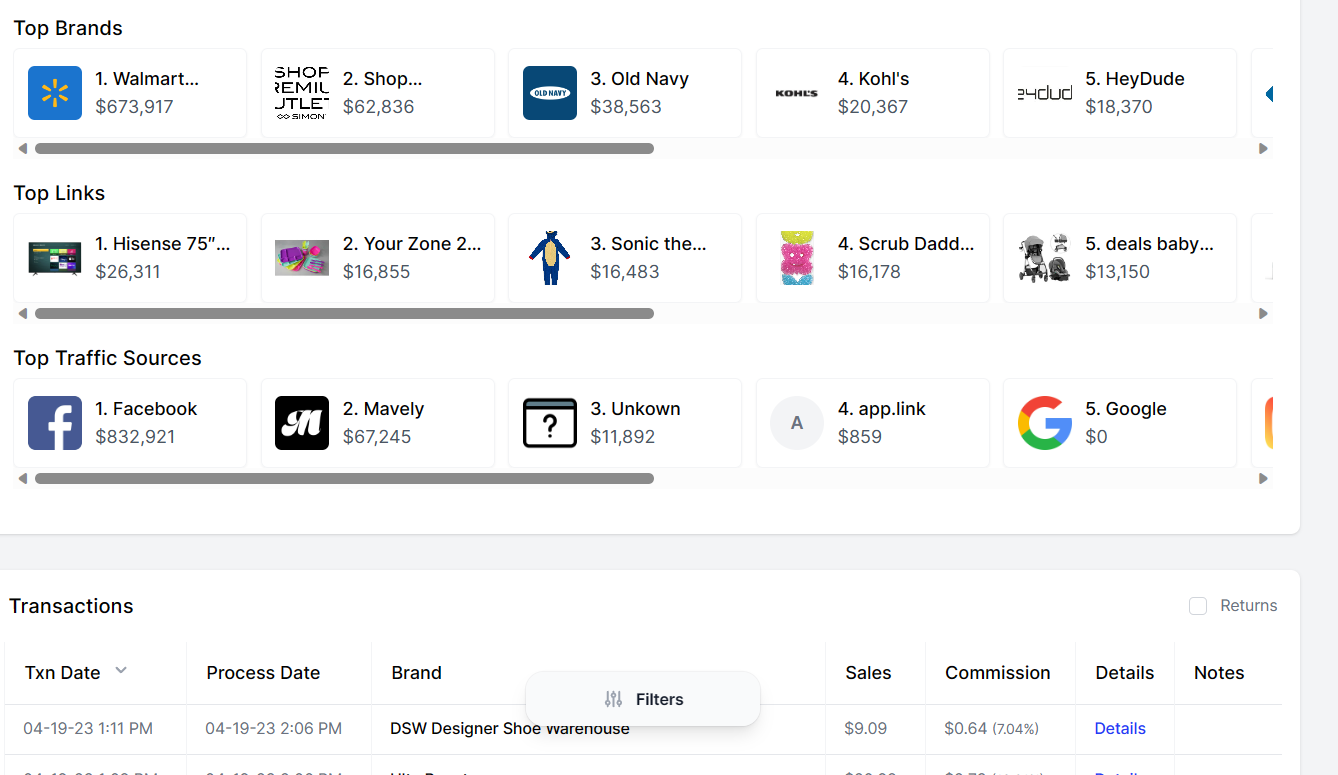
Click into filters to adjust the date range for reporting, regardless of position on the page. In addition to the ability to change date range, you can also select or edit the brand you are reviewing. Use the close button to close the filters, reset to reset the range or brand selection, and top to take you to the top of the page.

Overall Reporting Summary – Data, Reporting, and Display
You can leverage the summary reporting below the account at a glance line, to review:
-
Summary of top brands – allows you to see the data at the sales level, commissions, clicks, number of transaction / orders as well as the conversion rate. This allows you to quickly see your trending data from a high level overview before diving into the details.
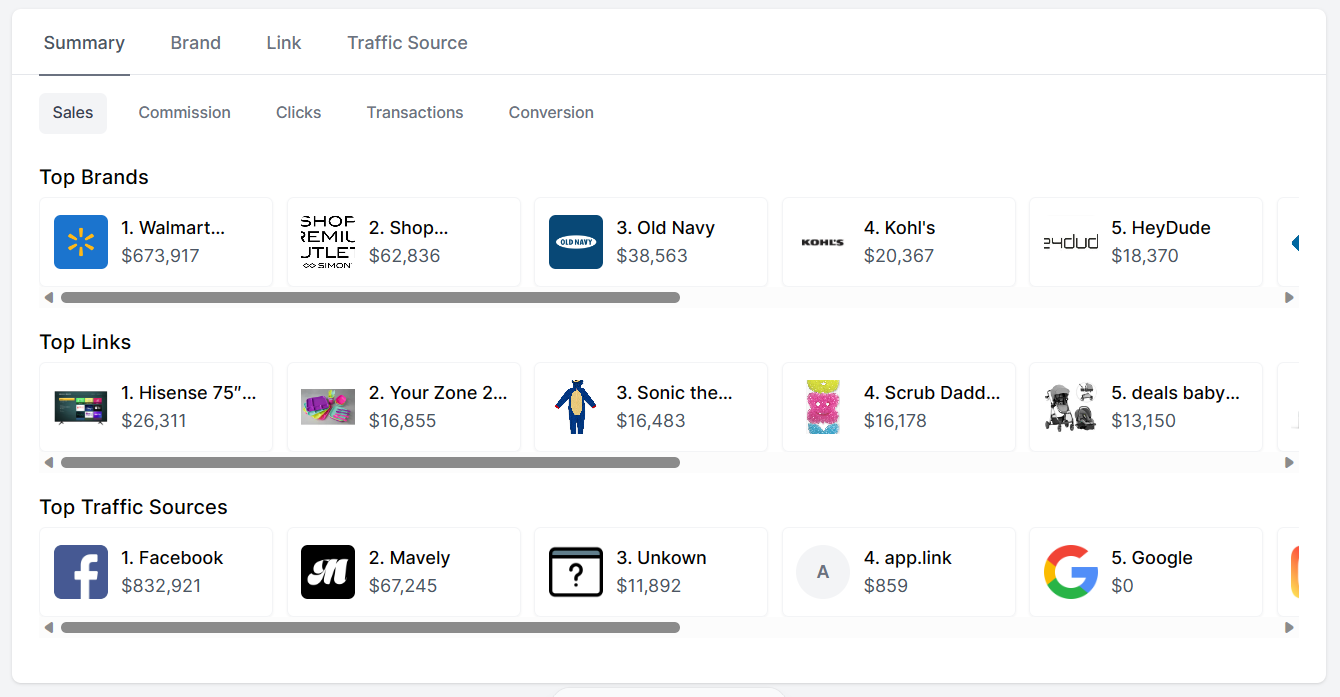
Example of Summary reporting based on commissions generated.
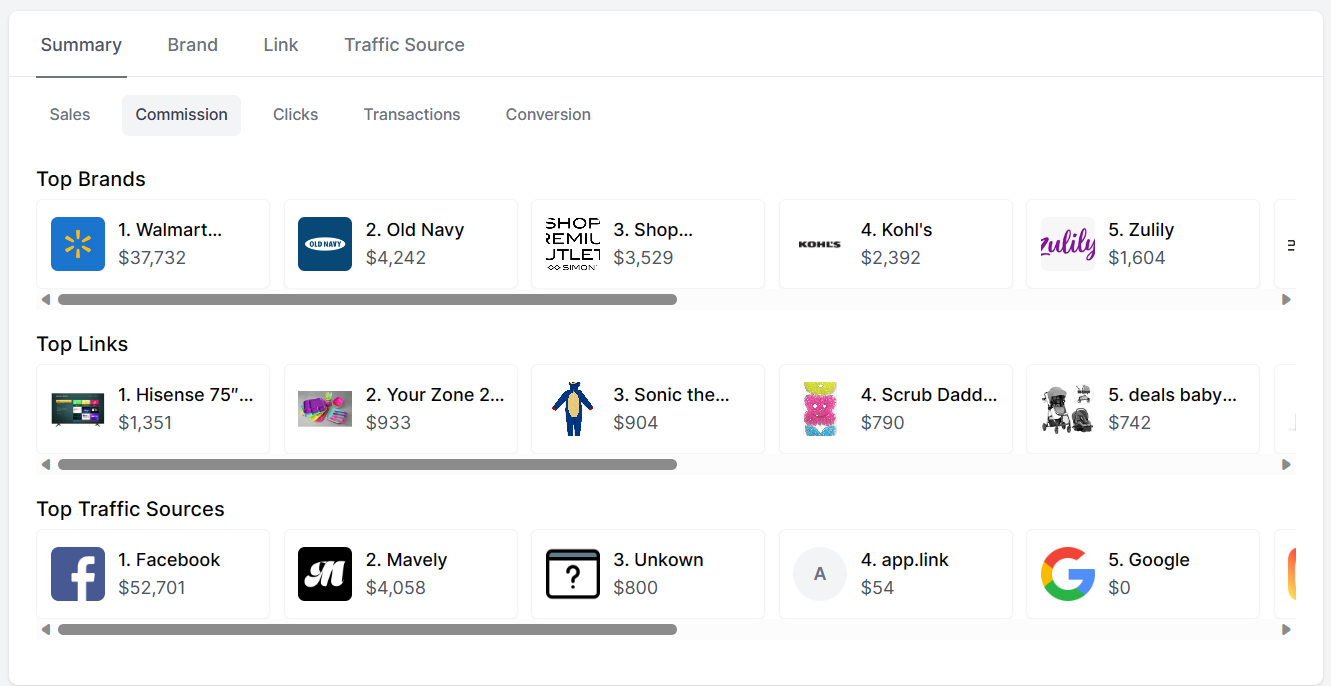
Example Summery reporting at the click level.
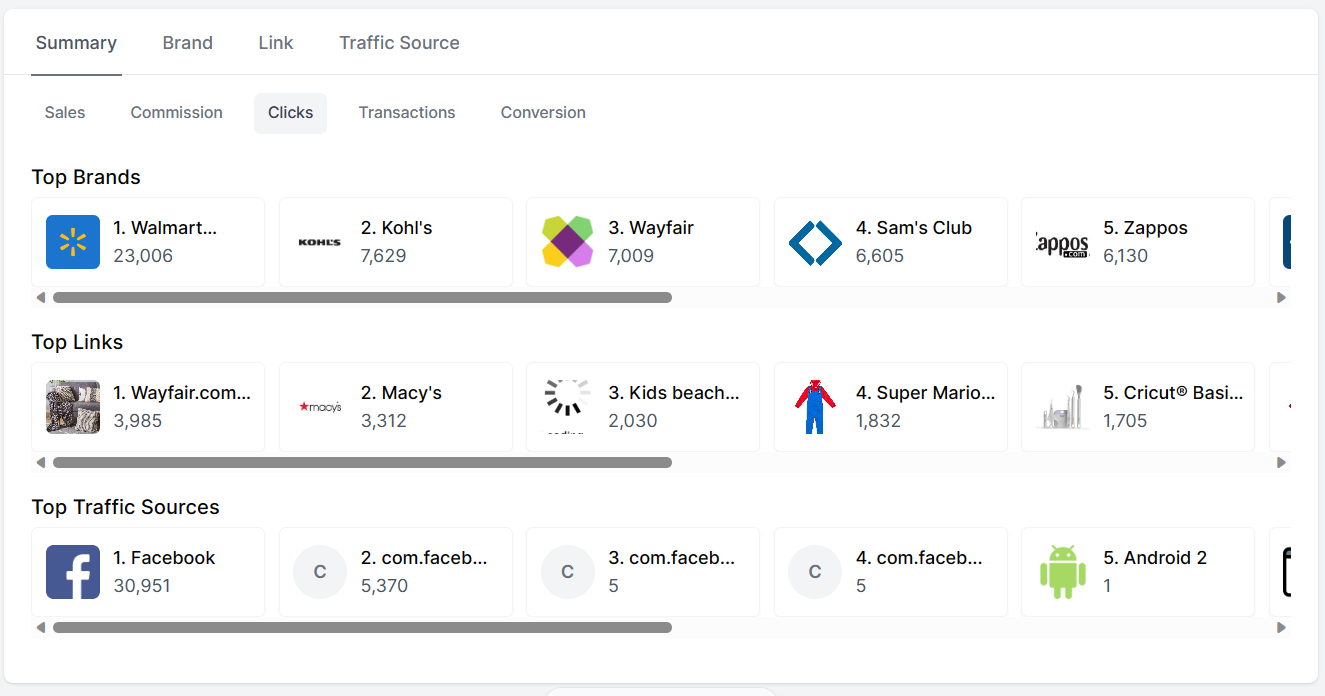
Once you have reviewed the overall summary, you will be able to deep dive into 3 key areas of reporting, and filter them based on what you are looking to review.
You will be able to deep dive into:
-
Brand
-
Links
-
Traffic sources
You will also have the ability to filter by:
-
Sales
-
Conversions
-
Clicks
-
Transactions
-
Conversion rate
In addition to the above, you will be able to edit how you display these data points. Either with a full data outline, a bar graph or a pie chart, depending how you plan to review your data.
Brand Reporting
To deep dive into your top performing brands, toggle to the BRAND label on the navigation bar.
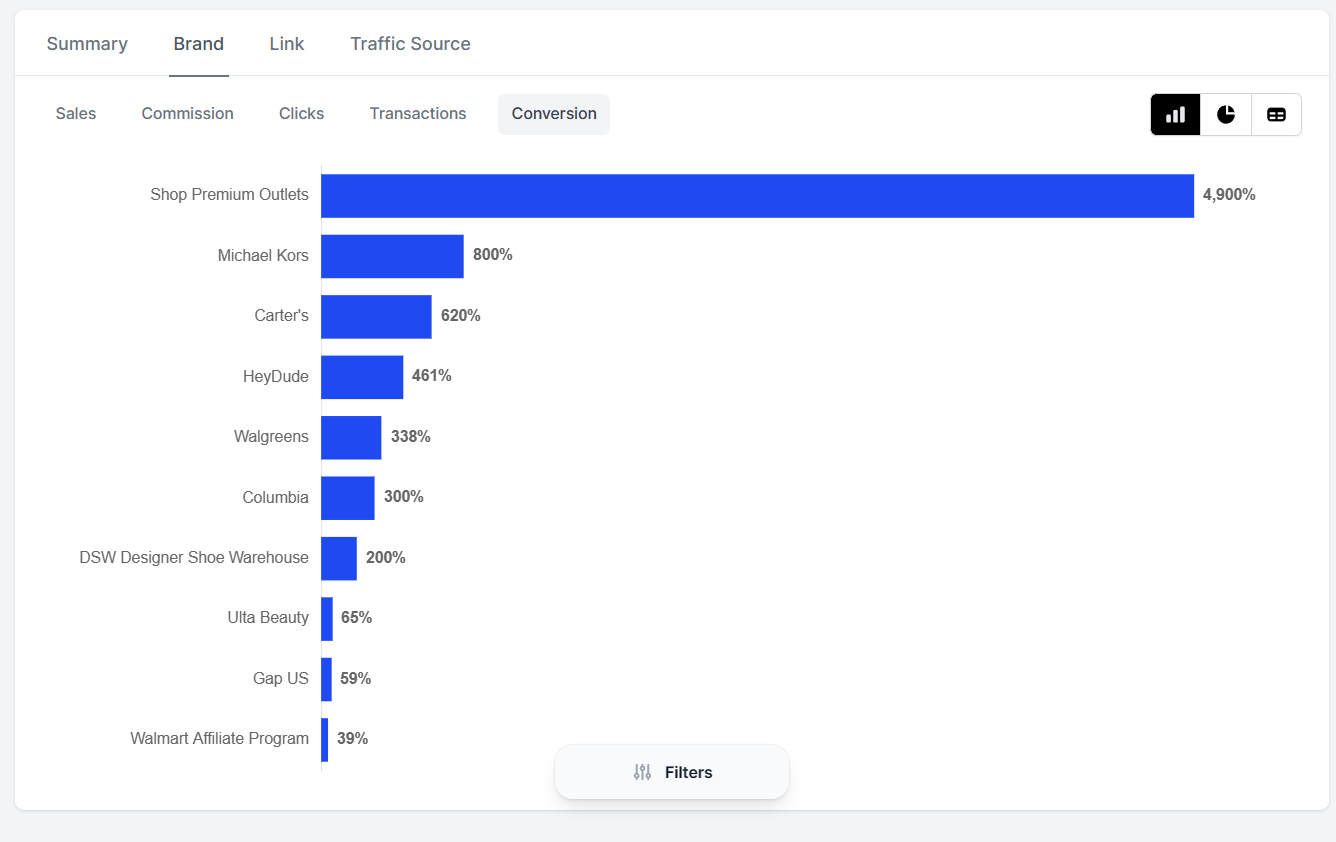
Once you have the selected brand, you will be able to determine the best view for how you want to review your data. There are 3 reporting views for you to select from.
-
Bar graph view ( see example above)
-
Pie chart
-
Full chart detail inclusive of all data metrics
Brand - Full Chart detail
This report will display all of the brands you are working with, and include data points such as: sales generated, commissions generated, number of transactions generated, clicks tracked for the applicable time period and overall conversion rate for each brand.
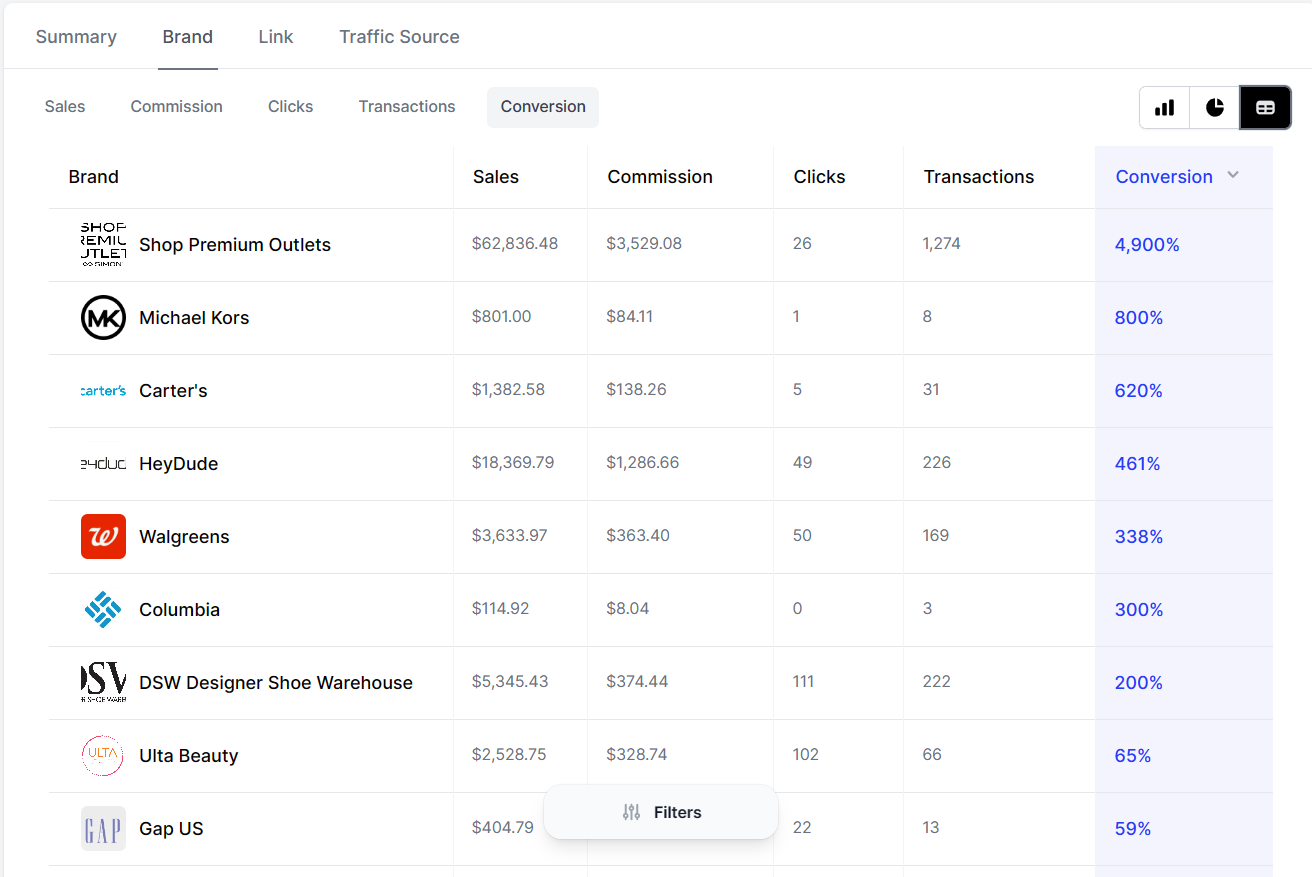
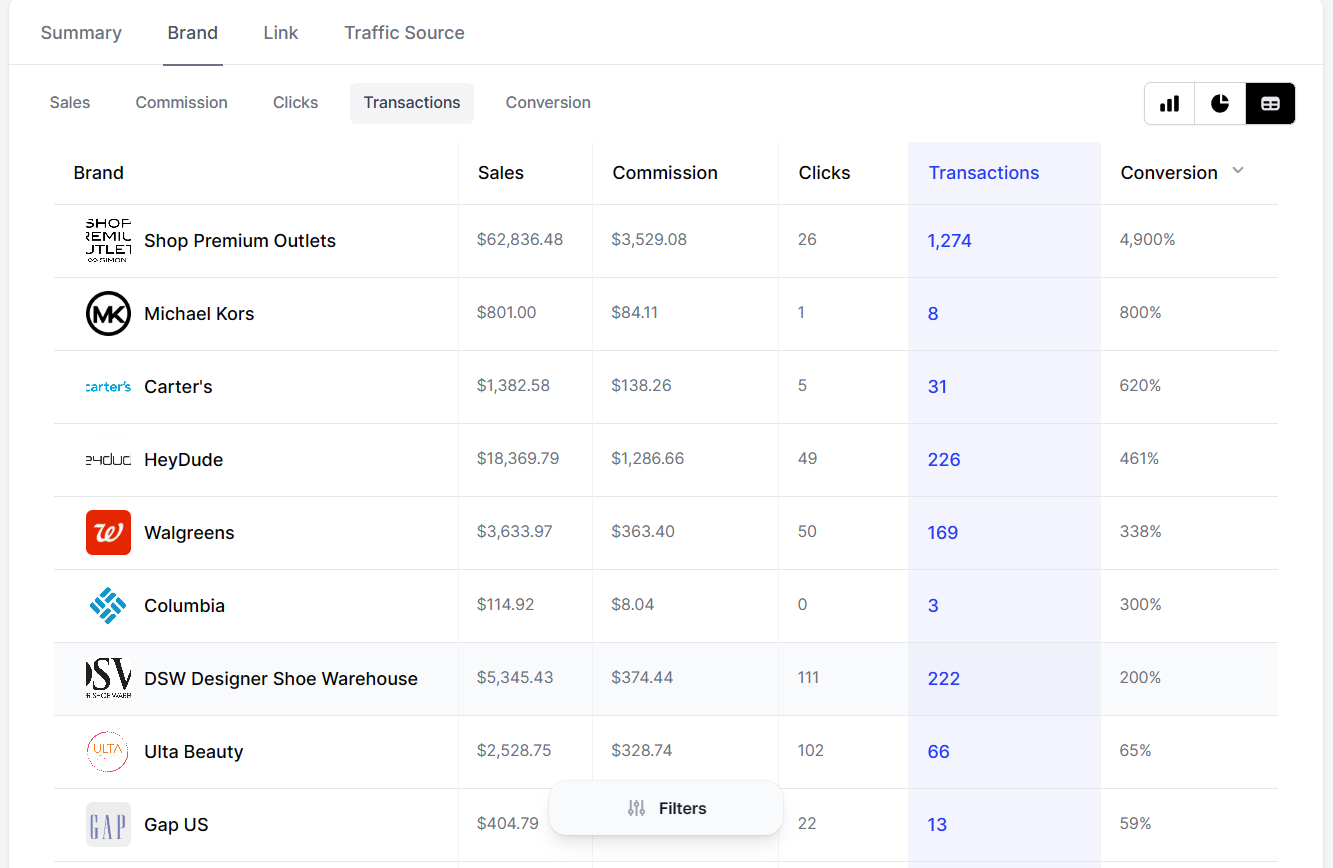
You can change the highlighted data set in the full chart view by selecting the metric you want to focus on. In the below example, Transactions has been selected, changing the highlighted column to be transactions.
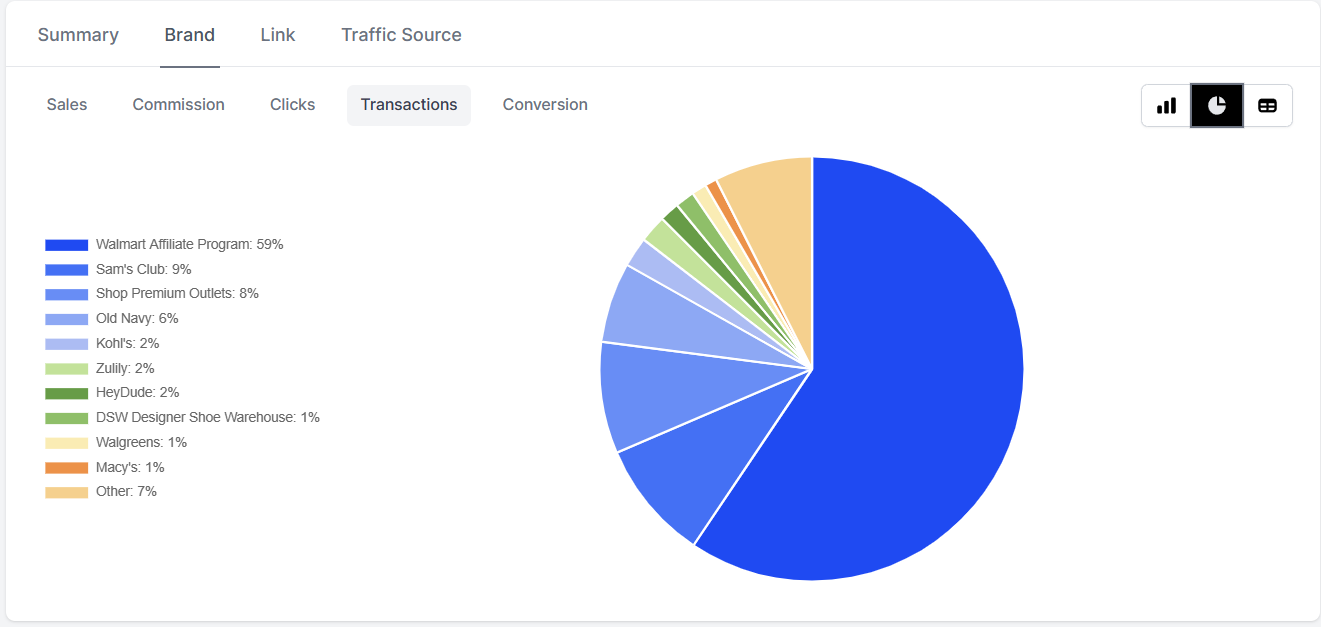
Brand Data Pie Chart
The pie chart will allow you to understand what concentration of the data set you are looking to review. You can see what brands, links and traffic sources the greatest concentration and overall percentage of your results come from what brand.
You can better understand what brands are your key drivers and what brands you not converting as well.
Link Reporting
Analytics allows you now to see what links you are sharing are performing the best overall. As with the brand reporting, you have the ability to view the data in 3 reporting visuals.
-
Bar graph
-
Pie Chart
-
Full Chart Detail
You can now see in real time what links are generating:
-
Sales
-
Commissions
-
Clicks
-
Transactions / Orders
-
Conversion rates by link
You will be able to see the product name/ link name, as well as the link created below the product imagery. Please note that we leverage the brands websites to pull in the product name.
To deep dive into your top performing link, toggle to the LINK label on the navigation bar.

In the example below you can see the top performing links and the sales generated from those sales.
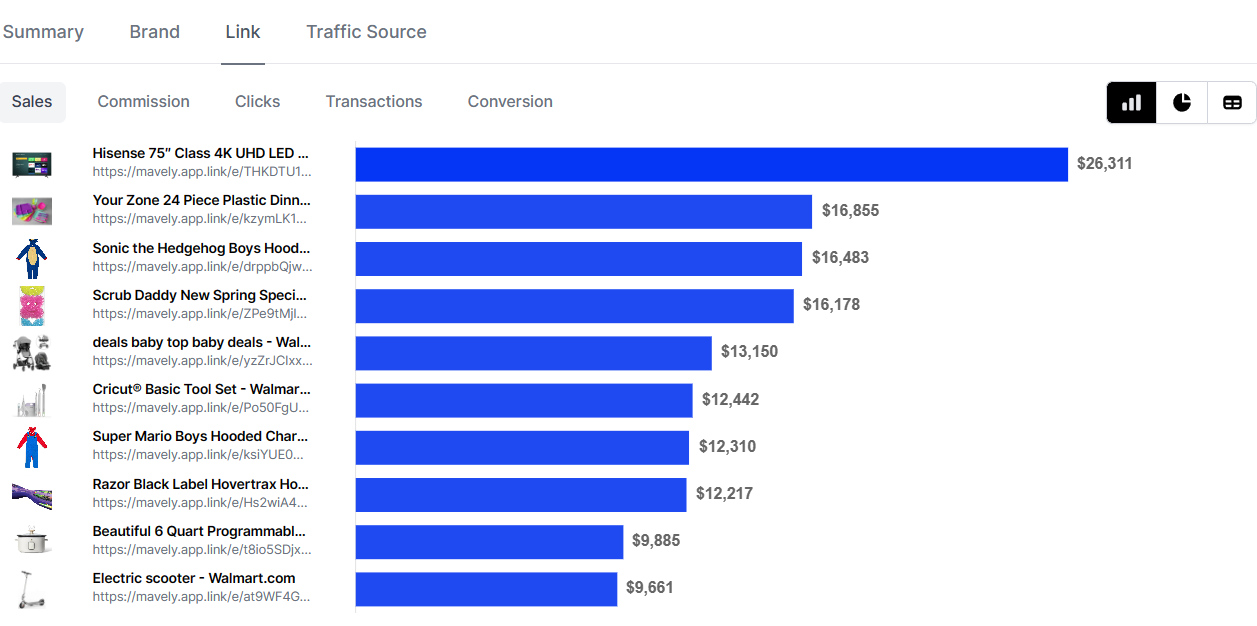
You can also review your data with the pie chart as well as the full chart detail.
The full chart detail will allow you to see the all of the data in one location to be better manage product promotion to your audience.
Traffic Source Reporting
The traffic source is the referring location for where you are promoting your Mavely links. The traffic source can be the social channels you are leveraging, as well as email, app devices and more. If a traffic location is masked, Mavely will pass the source back as unknown.
As with the brand and linking reporting, you can see the reporting in 3 reporting views.
-
Pie Chart
-
Bar Chart
-
Full chart review
You will be able to see which of your social channels, or other forms of promotion are performing the best based on your current efforts.
You will be able to monitor by:
-
Sales
-
Commissions
-
Clicks
-
Transactions / Orders
-
Conversion rates by link
To deep dive into your top performing traffic sources, toggle to the TRAFFIC SOURCE label on the navigation bar.

Below you can see an example of the full chart detail by traffic source, filtered to be able to focus on sales.
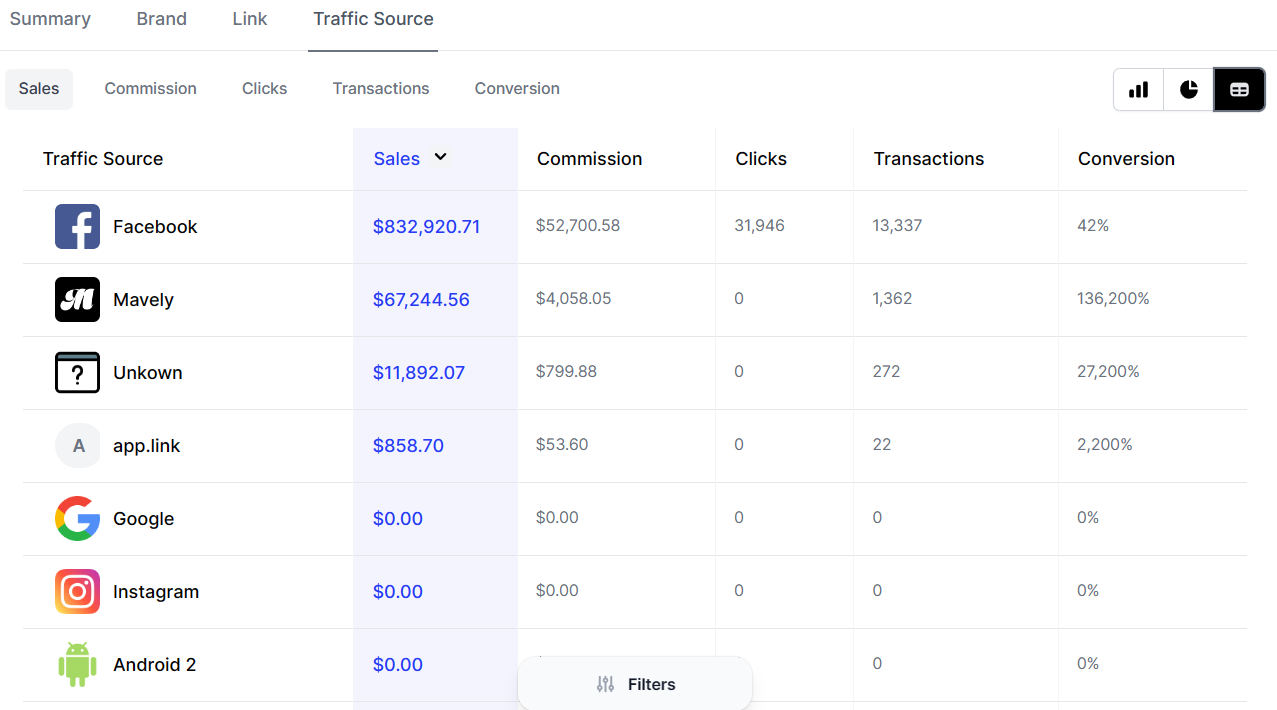
Another example for your top performing traffic through the bar chart visualization.
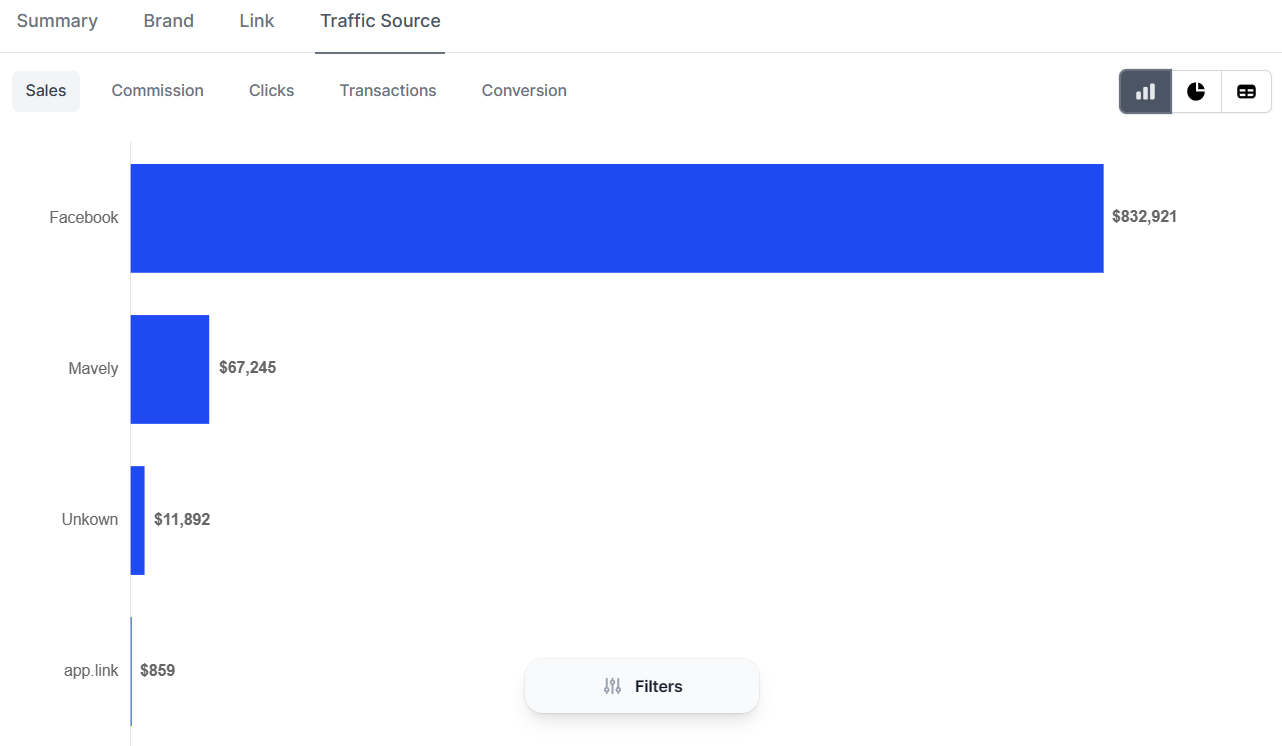
The Summary, brand, link and traffic source reporting is meant to give you the detail and insight into what is being sold where, and understanding how its not only converting, but performing as a whole.
Transaction Overview
At the bottom of the analytics page, you are able to deep dive into all of the transactional level data tracked for the time period you have selected.
Transactions can be both positive and negative in nature, we this report is meant to show all of the activity for the given month.
There are two dates associated with the transaction listed in the platform.
-
TXN Date: Transaction date / sale date for the transaction tracked.
-
Process Date: this is the date that the data was received by Mavely. The data received can be both positive and negative.
-
For new sales tracked – the transaction date and the process date may not be the same due the below:
-
Not all brands track in real time and as a result, we may receive those sales on a date that is not the transaction/ or sale date.
-
A brand add data post the sales date due to a tracking issue on their side
-
-
For returns
-
We process returns on the date we receive them into the system.
-
This allows you to see and isolate returns that may be impacting your reporting and data.
-
-
In addition to the two dates listed in the reporting, you will be able to see the name brand, overall sales total, commission, details, and applicable notes about the sale if existing. *** Please note that if a sale is return, within the notes column you will see the data listed as a return.
In the example below you can see a snapshot of transactions reported and tracked for April 2023.
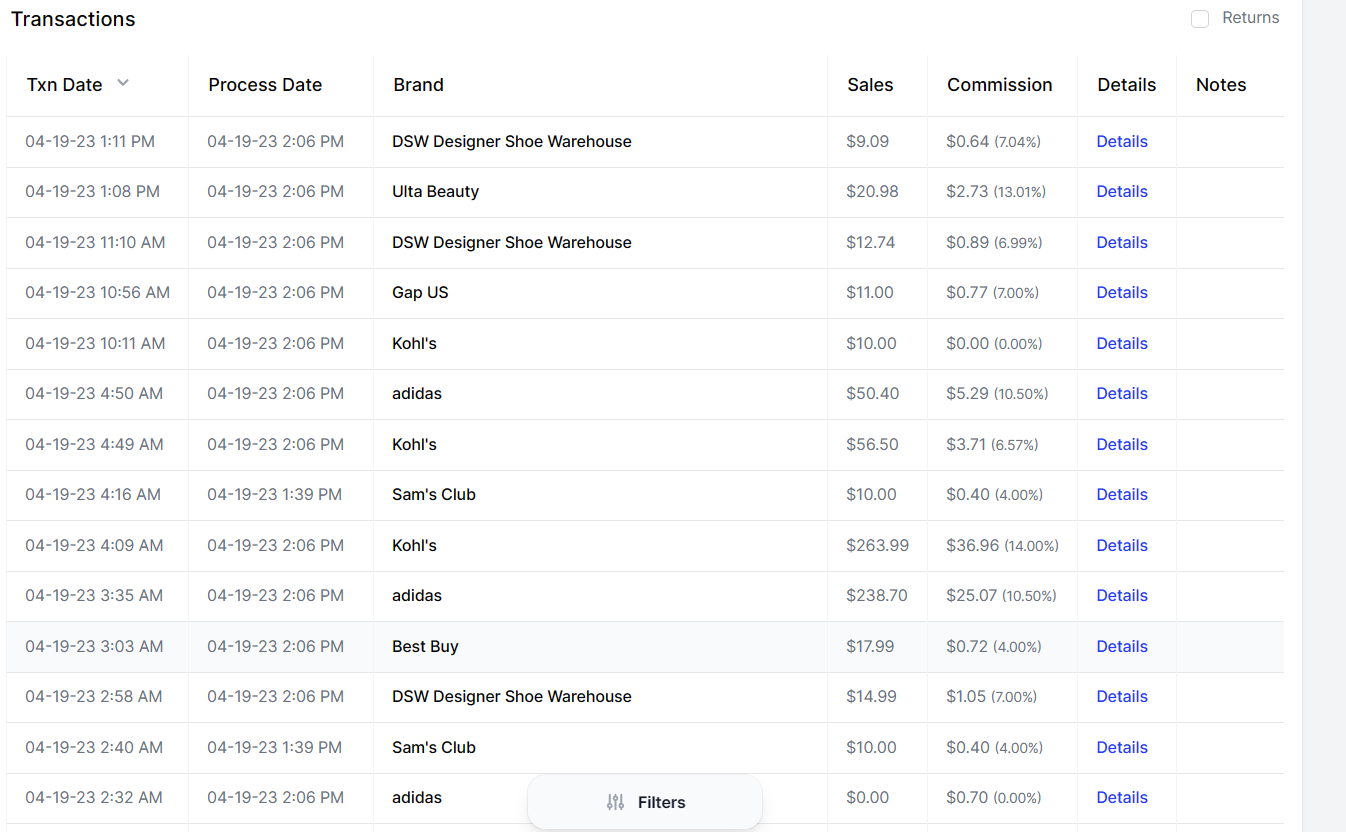
Transaction Detail Breakdown
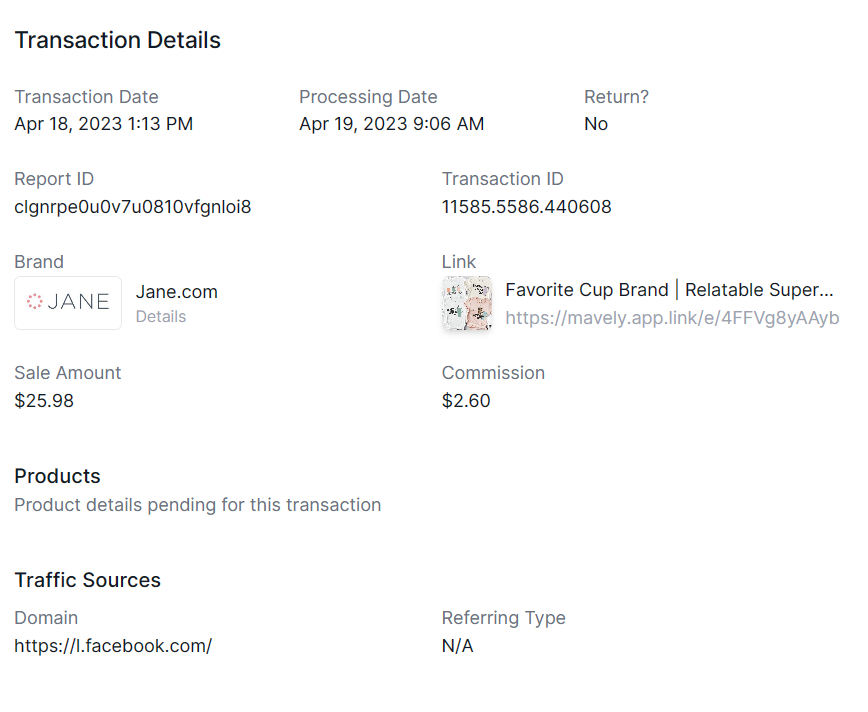
To gain more insight into any of the orders you are reviewing, you can click into the DETAILS to learn more about the sale.
In the detail pop out, you will be able to see and review the below metrics.
-
Transaction Date
-
Process date
-
Is the sale a return or not?
-
Transaction ID
-
Reporting ID (Internal to Mavely)
-
Name brand
-
Link associated with the sale
-
Sale amount
-
Commissions generated
-
Product level data associated with the sale
-
Traffic sources for the sale
This detail will allow you more transparency and data to better optimize your outreach and focus on items, pages, links and platforms that most resonate with your audience.
Return data
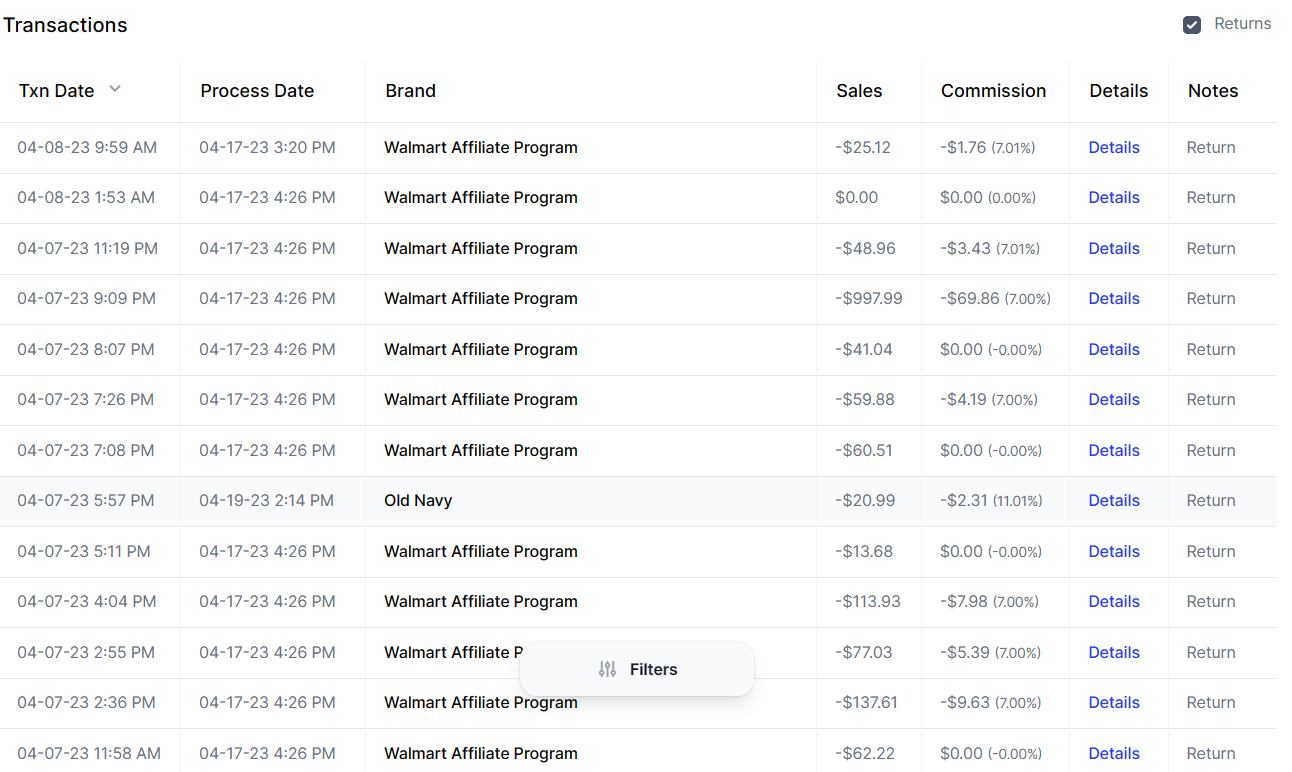
Located within the transaction level data, you will be able to see your returns more easily, and filter specifically for returns impacted the time period in question.
At the top of the transactions section of the page, on the far right hand side, you can see a box labeled returns.
By clicking on the returns box, you can isolate and highlight the returns that are associated with the time period you are reviewing.
In the below example, you can see that we isolated returns for April 2023, and in doing so you can see the data in one location.
If you have additional questions about data analytics, please email hello@joinmavely.com.